An ongoing challenge that technical presenters have is how can large data sets in charts and graphs be presented without overwhelming the audience. Showing the full set of raw data is often necessary to establish a starting point or source. It may also be important to not appear to be “dumbing-down” the information. But a slide with dozens or even hundreds of data points simply cannot be assimilated from the screen.
The solution is to make the data meaningful by distilling down your numbers to just the essential material. Begin with the full table or chart if you must (remember if you put it on the screen your audience will try to make sense out of it even if it is overwhelmingly complex) then quickly show just the important numbers you wish to highlight.
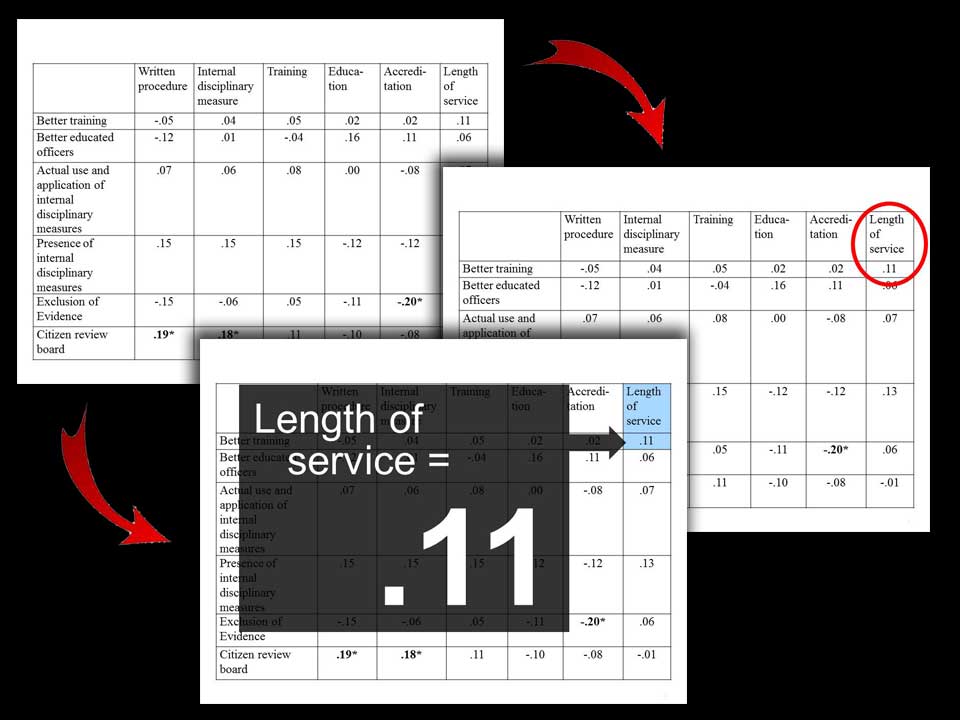
Above, the top slide shows the full chart. On the right is the simplest solution: draw a box or circle around the number you want to showcase. The bottom slide illustrates how to pull out a piece of data and enlarge it greatly while obscuring the chart (to focus attention on the important large text).
You are the expert. It is your job to zero in on the essential numbers or ideas – to show your audience what deserves their attention and what does not.